Tutorial: generate a timeline interface for data in Google Sheets
The tutorial will guide you in creating a web-based faceted search interface for collection data in Google Sheets.
You will:
- Create a Google Sheet for storing collection data
- Generate a website from the collection data using GitHub Actions
- Deploy the site using GitHub Pages
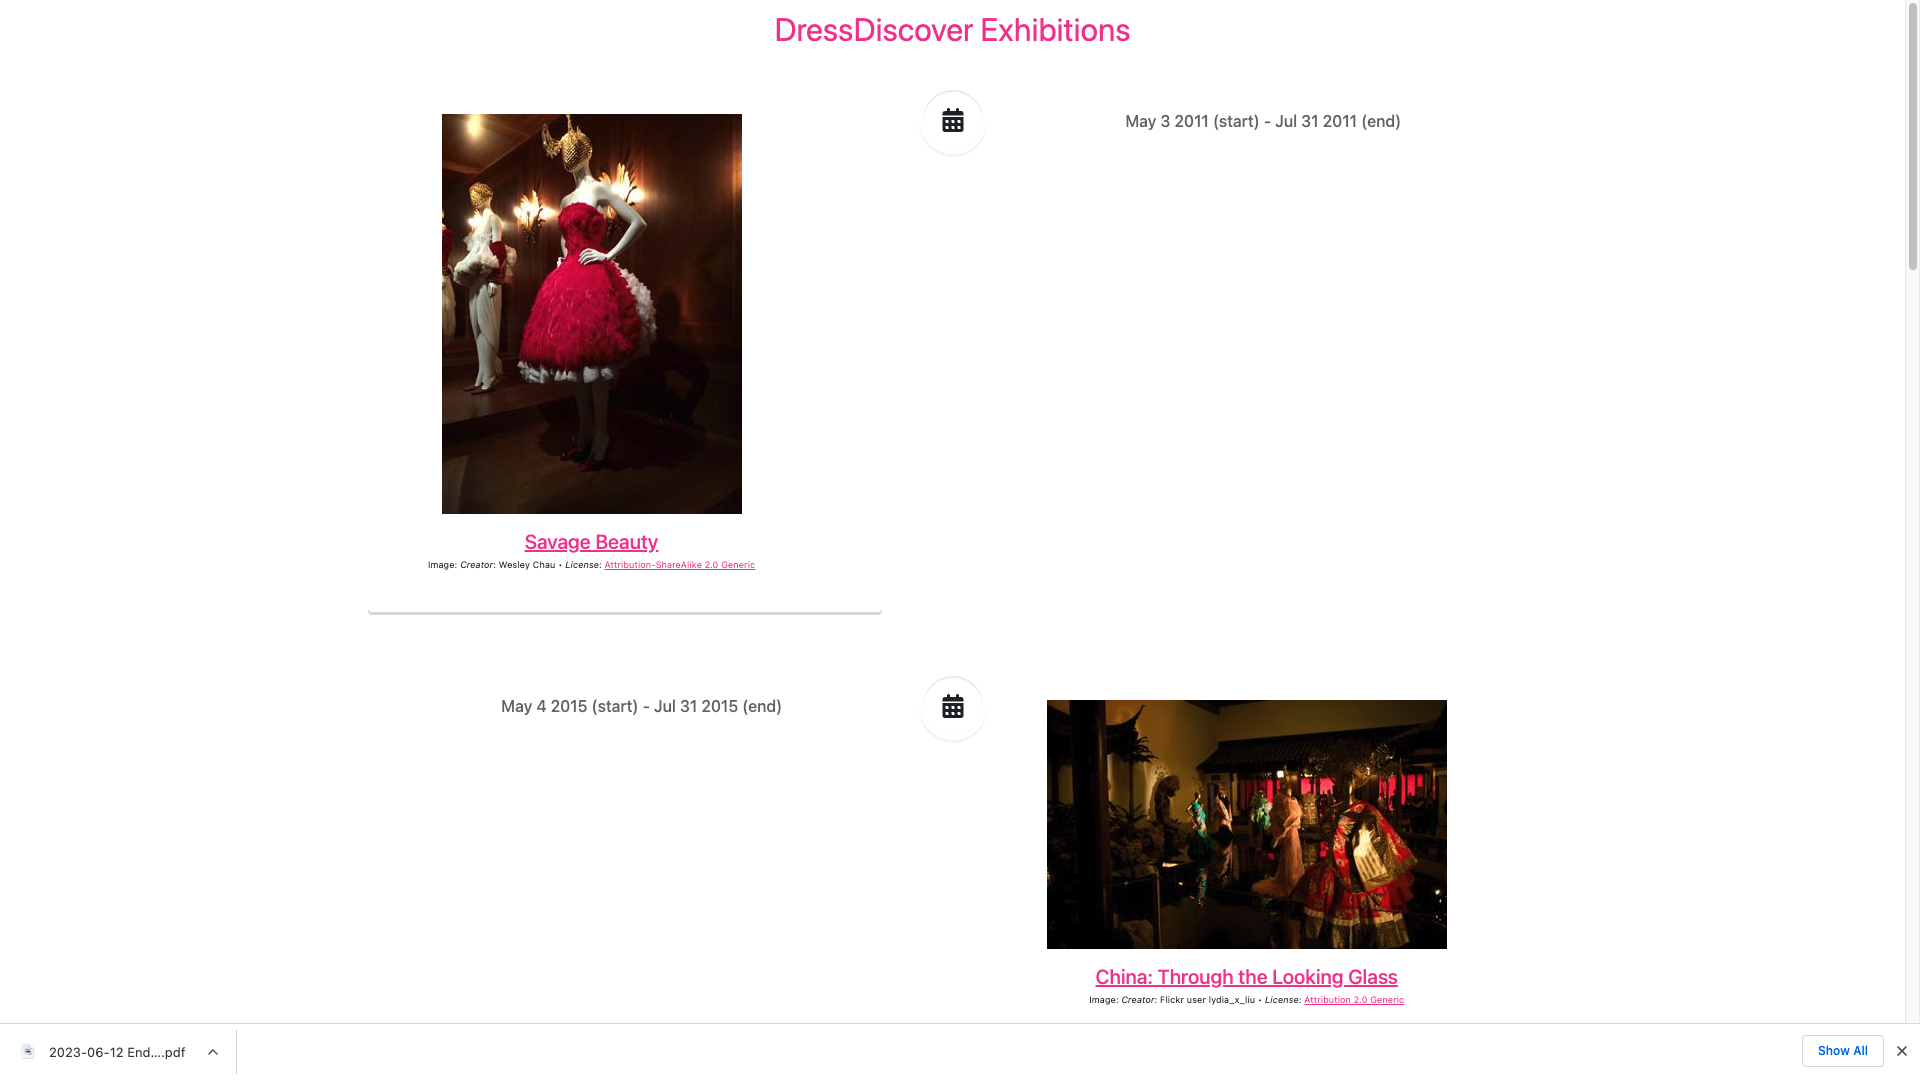
The end result will look like:

Before you start
For this tutorial you will need:
- A Google account to access Google Sheets
- A GitHub account to create a GitHub repository, set up GitHub Actions, and deploy your generated website using GitHub Pages
You do not need to install git or any other software on your computer.
Create and configure a Google Sheet
Follow the recipe on creating a Google Sheet for collection data.
Create and configure a GitHub repository
Copy the template GitHub repository
Follow these instructions on creating a GitHub repository from a template, using this template repository.
Configure GitHub Pages
Follow these instructions on publishing GitHub Pages with a custom GitHub Actions workflow.
Configure GitHub Actions
Find the URL of your Google Sheet in the address bar of your browser tab. It will start with docs.google.com.

Following these instructions, create a new repository secret with the name SPREADSHEET. The value should be the URL of your spreadsheet.
Generate the site
Follow the recipe on manually running a GitHub Actions workflow.
The GitHub Actions workflow is downloading the contents of the Google Sheet, transforming them to the Paradicms data model, generating the faceted search interface, and deploying it to GitHub Pages.
Navigate to your site
Follow the recipe on visiting your GitHub Pages site.
Your site is now available on the public Internet, and you can share it with people.
Next steps
Your new Google Sheet contains example collection data copied from the template. When you are ready, proceed to the tutorial on editing collection data in a spreadsheet.